時間線圖
在十分鐘之內,做出自己的時間線圖!
介面說明
你曾在網上看過很讚的時間線圖嗎?你也想要做出自己的時間線圖,又覺得太過麻煩嗎?
我們建置了這個網站來幫助你做出你自己的時間線圖,而且只要經歷三個步驟和花10分鐘的時間。
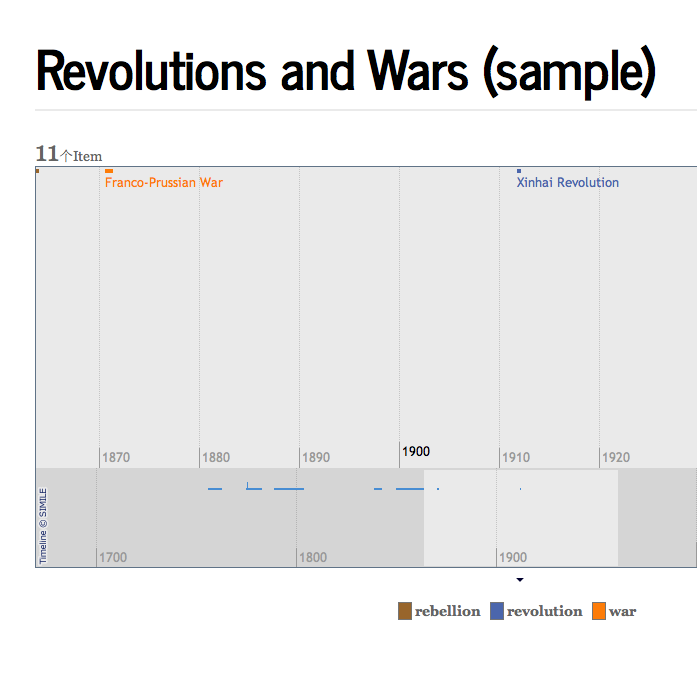
你可以點擊下面的時間線圖來參考我們所提供的範例。
你需要什麼來做出自己的時間線圖:
一個使用Google文件的帳戶
你的事件資料表
進行步驟
1.
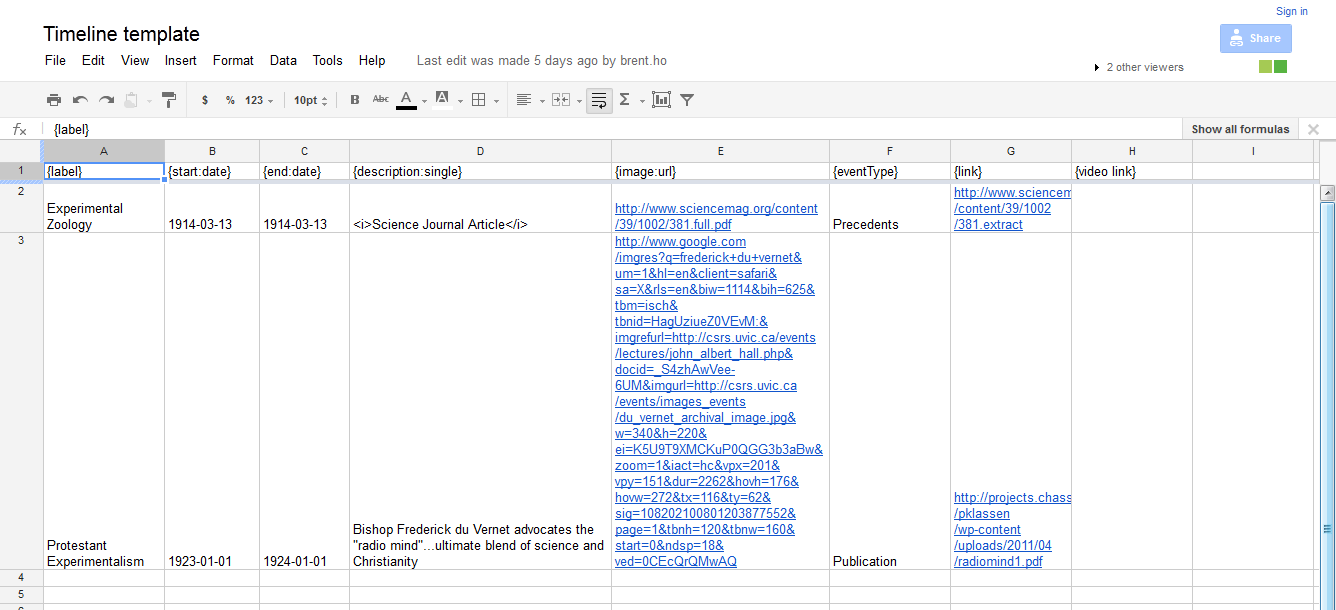
- 利用Google文件中的試算表(Spreadsheet)建立你的「事件資料表」。你的「事件資料表」必須包括幾個「欄」位,例如「label」(標籤)、start(開始)和end(結束)日期等等。我們已經為大家設置一個範本,請點擊此處以展開詳細步驟。
1.
2.
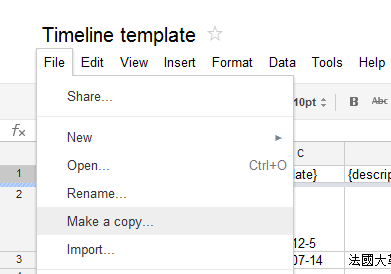
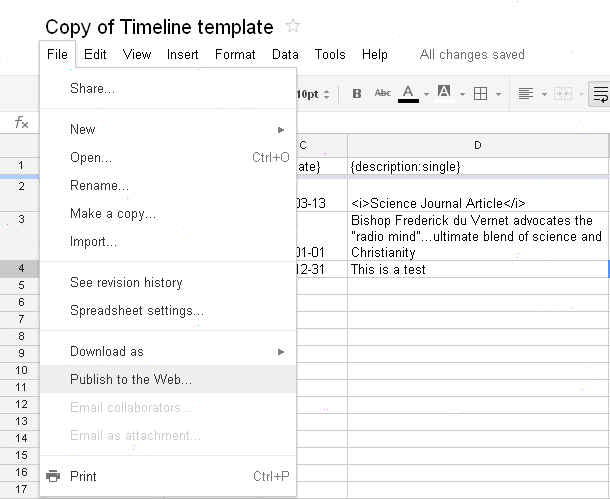
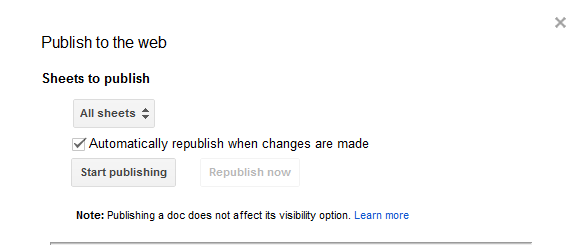
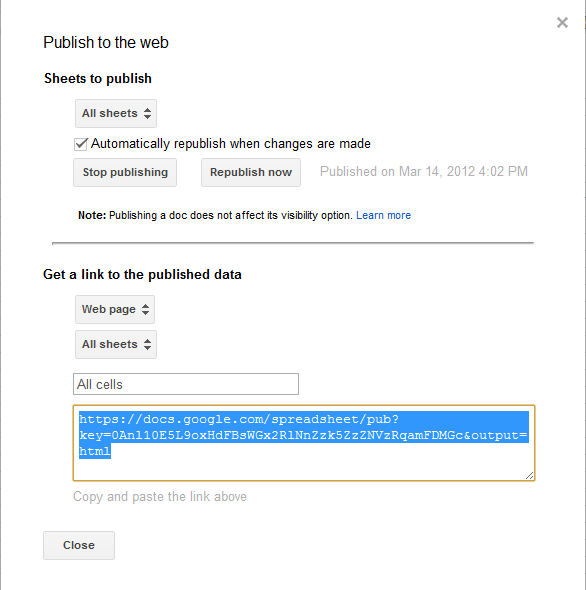
- 在填好你的事件資料表之後,你必須將檔案發佈到網路,這樣Simile Timeline才可以將你的事件資料表轉為時間線圖。請點擊此處以展開詳細步驟。
2.
3.
- 將2中所複製的連結網址剪貼到下面空格
3.
關於我們
Who are we ?
We are Hou Ieong Ho and Shih-Pei Chen, two computer scientists interested in helping humanists to take full advantage of information technologies.Why do we do this?
This website is an effort born out of the Digital Humanities 2.0 Workshop @ Harvard University, and is inspired by Dennis Tenen, our lecturer who tried to teach the whole class to build their own timeline by following this tutorial by Brian Croxall.Credits
Simile Timeline visualization: from MIT.Sample events (in Google Spreadsheet) by Feng-en Tu
中文翻譯 祝平次